The $69 Billion Mirage: How an Accounting Rule Inflated S&P 500's Q1 Earnings by 12%
If you glanced at the front-page financial headlines for Q1 2026, you likely saw a victory lap for corporate America. Wall Street is celebrating the sixth consecutive quarter of double-digit earnings growth for the S&P 500. The annualized earnings growth rate for Q1 2026 clocked in at a staggering 28%, a figure that sits way above the 5-year historical average earnings growth rate of 16%.
But if you peel back the curtain and look at the actual anatomy of these corporate earnings, a bizarre structural distortion emerges.
A massive chunk of this quarter’s blockbuster “growth” didn’t come from selling more software, shipping more microchips, or delivering more packages. Instead, it came from an accounting rule that forced massive, illiquid “paper gains” onto the income statements of tech giants.
In Q1 2026 alone, just three companies—Alphabet, Amazon, and Nvidia—reported a staggering $69.2 billion in non-operating windfall under their Other Income and Expenses (OI&E) lines. When you run the macro numbers, this single accounting phenomenon artificially inflated the entire S&P 500’s quarterly earnings by about 12%.
**Understanding OI&E**
In standard corporate accounting, Other Income (Expense), net is typically a sleepy, neglected corner of the financial statement. It is designed to capture items strictly outside a company’s core operations—things like interest earned on cash reserves, foreign exchange fluctuations, or minor investment tweaks.
Historically, this line item was a rounding error. Today, it’s an engine of massive earnings distortion.
The culprit is an accounting standard known as ASU 2016-01. Under GAAP rules, companies are required to measure their equity investments in both private and public companies at “fair value” at the end of every single quarter.
> · **Up-Round Markups:**If a startup they invested in raises a new private funding round at a higher valuation, the corporate backer must mark up the value of their shares on their own balance sheet. > > > · **Income Statement Impact:**Crucially, that imaginary, unrealized “paper profit” must be funneled directly through the income statement under the OI&E line.
Because we are currently riding an unprecedented wave of capital concentration into private AI infrastructure, late-stage tech startups, and secondary markets, these private valuations have gone completely parabolic.
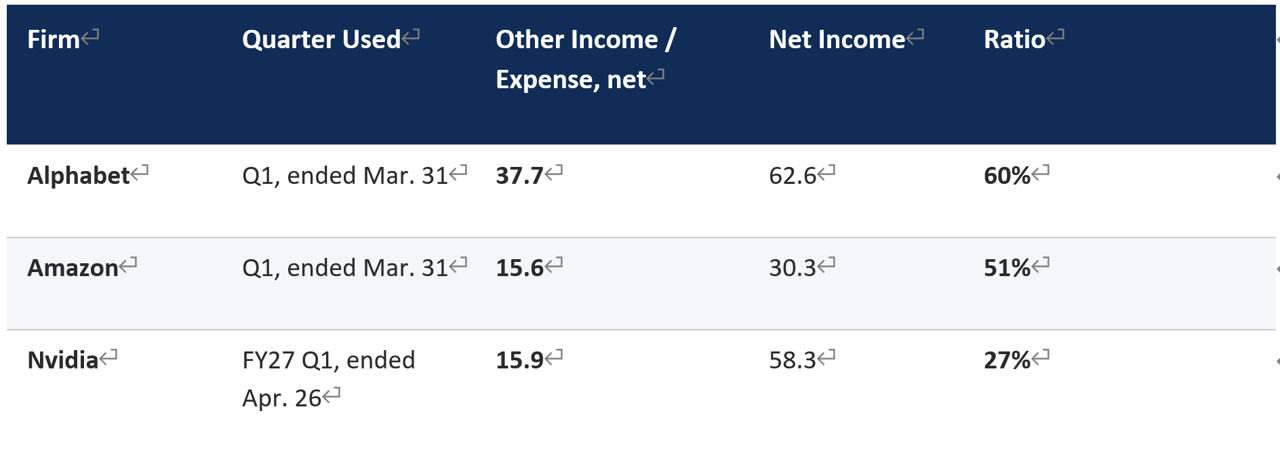
**The Big Three Windfalls**
To see how extreme this trend has become, look at the literal billions that hit the books of Big Tech this quarter (all dollar figures in billions):

Let’s be entirely clear about what these numbers mean: 60% of Alphabet’s, 51% of Amazon’s, and 27% of Nvidia’s reported net income this quarter came from non-operating, illiquid paper gains. The only issue of these earnings is that their “quality” is lower than operating earnings, in the sense that we do not expect them to reoccur.
**The Macro Math of the S&P 500**
To put a $69.2 billion non-cash surge into perspective, we have to look at the total earnings footprint of the entire index.
Annualized total earnings for the S&P 500 are currently projected to hover around $2.3 trillion. If we split the difference at a baseline of $2.3 trillion for the full year, a typical, clean quarter should yield roughly one-fourth of that total:
**$2.3 Trillion / 4 = $575 Billion in Quarterly S&P Earnings**
Now, let’s look at the mathematical leverage that just three companies’ non-operating paper profits exerted over the entire index’s bottom line:
**$69.2 Billion (Big Three OI&E) / $575 Billion (Total S&P Q1 Earnings) = 12.0%**
> _The Takeaway: More than 12 cents out of every single dollar of profit reported across all 500 of America’s largest companies this quarter was an illiquid, non-operating mark-to-market adjustment from just three balance sheets. Such an effect inflates the earnings by 12% but inflates the earnings growth by about 75% (from 16% to 28%). **Without the OI&E lines, the Q1 2026 earnings growth rate will not be very different from the 5-year average of 16%.**_
**The Danger of a “Circular Valuation” Loop**
For Substack readers and macro investors, this creates a highly volatile, circular feedback loop that investors should be watching closely:
> · **1. Public Multiples Expansion:**Public markets trade at premium, heavily driven by the AI narrative. > > > · **2. The Private Premium:**High public multiples justify sky-high private valuations for venture-backed AI startups during private funding rounds. > > > · **3. The Earnings Mirage:**Big Tech marks up those private holdings, inflating their own public GAAP earnings via OI&E. > > > · **4. The Justification:**Wall Street looks at the “blowout” public GAAP earnings, declares tech valuations are fully justified by earnings growth, and bids the public stock prices even higher.
Please note that the underlying operating health of these businesses remains exceptionally robust—both Amazon’s AWS and Google Cloud grew very fast. They don’t need to fake it.
But by letting the volatile, illiquid world of venture capital markups dictate public net income lines, the market has introduced a massive blind spot. If the private venture market chills out later this year, or if an AI scale-up undergoes a down-round, these exact same accounting rules will force billions in non-operating losses down the index’s throat.
**But a more likely scenario is that we should not expect these OI&E earnings to reoccur. I am not sure whether the market has made the distinction between operating earnings and OI&E. As discussed above, without the OI&E lines, the Q1 2026 earnings growth rate will not be very different from the 5-year average of 16%.**
_**Disclaimer:** This piece reflects my personal speculative take. Some of the aggregate numbers are baseline estimates meant for illustrative mapping rather than hyper-precise auditing. Read (and invest) at your own risk._