Intel Arc Pro B70 Review
Intel Arc Pro B70 Review | Puget Systems
Main Navigation 
- * Search
- Recommended Systems For:
- Video Editing & Motion Graphics
- Recommended Systems For:
- Recommended Systems For:
- Blender
- Houdini
- ZBrush
- Recommended Systems For:
- vMix
- Recommended Systems For:
- Unity
- Recommended Systems For:
- Keyshot
- Redshift
- V-Ray
- Recommended Systems For:
- Recommended Systems For:
- Recommended Systems For:
- Enscape
- Keyshot
- Lumion
- Recommended Systems For:
- Pix4D
- AI & HPC
- Recommended Systems For:
- Servers for Scaling AI & LLMs
- Recommended Systems For:
- More
- Recommended Systems For:
- Business & Enterprise We can empower your company
- Government & Education Services tailored for your organization
- Products
- Puget Mobile Powerful laptop workstations
- Puget Mobile 16″ Intel Core Ultra + NVIDIA GeForce
- Puget Workstations High-performance Desktop PCs
- AMD Ryzen Powerful CPUs with up to 16 cores
- AMD Threadripper High core counts and lots of PCIe lanes
- AMD EPYC Server-class CPUs in a workstation
- Intel Core Ultra Balanced single- and multi-core performance
- Intel Xeon Workstation CPUs with AVX512
- Configure a Custom PC Workstation Configure a PC for your workflow
- Puget Rackstations Workstations in rackmount chassis
- AMD Ryzen, Threadripper, and EPYC CPUs
- Intel Core Ultra and Xeon Processors
- Configure a Custom Rackmount Workstation Tailored 4U, 5U, and 6U rack systems
- Puget Servers Enterprise-class rackmount servers
- 1U Rackmount Dense CPU compute servers
- 2U Rackmount Mixed CPU and GPU solutions
- 4U Rackmount High-density GPU computing
- Comino Grando GPU Servers Liquid-cooled GPU rackmount systems
- Custom Servers Engineered to meet your unique needs
- Puget Storage Solutions from desktop to datacenter
- Network-Attached Storage Synology desktop and rackmount NAS
- Software-Defined Storage Datacenter solutions with QuantaStor
- Recommended Third Party Peripherals Curated list of accessories for your workstation
- Puget Bench for Creators Professional benchmarking tools
- Articles
- HPC Blog
- Podcasts
- Press
- Support
- Unboxing
- About Us
- About Us
- Careers
1. Home 2. / 3. Hardware Articles 4. / 5. Intel Arc Pro B70 Review
Intel Arc Pro B70 Review
Posted on April 23, 2026 (April 23, 2026) by[Evan Lagergren](https://www.pugetsystems.com/bios/evanlagergren/ "Posts by Evan Lagergren") | Last updated: April 23, 2026
Table of Contents
- Premiere
- Blender
- Unigine
- MLPerf
- Revit
- Inventor
- Intel Arc Pro B70 Performance Summary
Introduction
One of the key factors for AI-focused GPUs is memory capacity. In order to run models well — if at all — they must be stored in memory local to the GPU compute die. And given that GPUs are far more performant for most AI workloads than are CPUs, that means it must be stored in VRAM. To that end, we have seen increasingly large memory buffers on midrange professional GPUs targeted towards AI use cases. For example, last year AMD released the AMD Radeon™ AI PRO R9700, which repurposed the 9070 XT into an AI card by doubling the VRAM to 32 GB. At the higher end, NVIDIA released a 72 GB version of its NVIDIA RTX PRO™ 5000 Blackwell.
Now, Intel has thrown its hat into the ring with the launch of the Intel® Arc™ Pro B70. However, unlike AMD and NVIDIA, Intel is not merely retrofitting an existing GPU with additional VRAM. Instead, the B70 is a whole new entry into the product stack, featuring twice the Xe cores and VRAM of the Intel Arc Pro B50, bringing it to 32 GB of memory.
In our previous testing of the Arc Pro B50, we found substantial improvements over their last-gen Alchemist cards, such as the A50. Intel’s second-generation Xe2 architecture brought along a wide variety of enhancements, from SIMD16 execution to next-gen XMX engines, which dramatically improved both raw performance and efficiency. Additionally, over the last few years, Intel has worked hard to improve support, compatibility, and optimizations within its driver stack — with the latter often substantially improving the performance of already-released hardware.
Just like the currently-existing B50, the B70 has dual media engines. Each has an encoder and decoder for up to two 8K 10-bit workloads. In terms of codec support, Intel’s media engine has acceleration for HEVC 8-, 10-, and 12-bit (decode only) 4:2:0, 4:2:2, and 4:2:0, as well as AV1, among other codecs.
As this is a professional GPU, the Arc Pro B70 offers a number of features not typically seen on consumer parts. This includes ECC memory as well as certified drivers that are tested to offer stability and reliability of performance and results across a variety of products from professional independent software vendors such as Adobe, Autodesk, and Dassault Systèmes.
As mentioned earlier, the Intel Arc Pro B70 boasts a much larger GPU die than the B50, alongside a variety of other changes to the graphics card’s specifications. In the table below, we have listed the most relevant specs for comparable Intel, AMD, and NVIDIA GPUs:
| wdt_ID | wdt_created_by | wdt_created_at | wdt_last_edited_by | wdt_last_edited_at | GPU Model | Launch Price | VRAM | VRAM Bandwidth | FP 32 Performance | Matrix Performance | TDP | | --- | --- | --- | --- | --- | --- | --- | --- | --- | --- | --- | --- | | 1 | Evan | Mar 2026 11:42 AM | Evan | Mar 2026 11:42 AM | NVIDIA RTX PRO 4500 Blackwell | 2,500 | 32 | 896 | 55.00 | 1,744 | 200 | | 2 | Evan | Mar 2026 11:42 AM | Evan | Mar 2026 11:42 AM | NVIDIA RTX PRO 4000 Blackwell | 1,500 | 24 | 672 | 37.00 | 1,178 | 145 | | 3 | Evan | Mar 2026 11:42 AM | Evan | Mar 2026 11:42 AM | NVIDIA RTX PRO 2000 Blackwell | 700 | 16 | 288 | 17.00 | 545 | 70 | | 4 | Evan | Mar 2026 11:42 AM | Evan | Mar 2026 11:42 AM | AMD Radeon AI PRO R9700 | 1,300 | 32 | 640 | 47.80 | 1,531 | 300 | | 5 | Evan | Mar 2026 11:42 AM | Evan | Mar 2026 11:42 AM | Intel Arc Pro B70 | 950 | 32 | 608 | 22.94 | 367 | 230 | | 6 | Evan | Mar 2026 11:42 AM | Evan | Mar 2026 11:42 AM | Intel Arc Pro B60 | 500 | 24 | 456 | 12.00 | 197 | 200 | | 7 | Evan | Mar 2026 11:42 AM | Evan | Mar 2026 11:42 AM | Intle Arc Pro B50 | 300 | 16 | 224 | 10.65 | 170 | 70 |
On paper, the B70 is basically just two B50s stapled together: It offers twice the Xe-cores and twice the VRAM… at 2.7x the cost. It seems there is an additional cost for putting that much VRAM on a single card, but it is not large enough to be a deal breaker. There are some other differences as well: Intel doubled the memory bus width to 256-bit and more than doubled the total memory bandwidth from 224 to 608 GB/s. Clock speeds also increased, with the “graphics” clock improving from 1700 MHz to 2280 MHz (the graphics clock is a “typical” frequency achieved in workloads), and the boost clock increased from 2600 MHz to 2800 MHz. As would be expected, these increases all come with commensurate power needs, so the TDP more than tripled, from 70 W to 230 W. As a result of all these changes, Intel claims that the expected FP32 performance is 22.94 TFLOPS and the peak INT8 is 367 TOPS.
There aren’t any great direct competitors for the B70. Intel seems to have purposefully undercut the most likely, AMD’s R9700, by about 30%. Both the R9700 and B70 feature 32 GB of VRAM and similar memory bandwidths, but on paper, the R9700 seems much more competent, with twice the FP32 performance and 5 times the matrix performance — though there is no real consensus on how the latter is calculated. When comparing it to NVIDIA, the B70 is $200 more expensive than the 2000 Blackwell, while offering twice the VRAM and similar FP32 performance. The 4000 Blackwell is the next step up, but costs $550 more than the B70 — and, to match the B70’s 32 GB of VRAM with an NVIDIA GPU, we have to go all the way up to the 2.5x more expensive 4500 Blackwell.
For this review, we will primarily be focusing on a comparison with the R9700, followed by the 2000 Blackwell. We will also note comparisons to the B50 when we want to show how the architecture scales.
Test Setup (Expandable)
#### Test Platform
CPUs:
AMD Ryzen™ 9 9950X3D CPU Cooler: Noctua NH-U12A Motherboard:ASUS ProArt X670E-Creator WiFi
_BIOS Version: 3513_ RAM: 2x DDR5-5600 32GB (64 GB total) EVGA SuperNOVA 850W P2 Storage: Samsung 980 Pro 2TB OS: Windows 11 Pro 64-bit (26200)
#### Intel GPUs
_Driver: 101.8515_
#### NVIDIA GPU
_Driver: 595.71_
#### AMD GPU
_Driver: 26.3.1_
#### Benchmark Software
Adobe Lightroom Classic 15.2 — Puget Bench for Lightroom Classic 1.0.0 Adobe Premiere 26.0 — Puget Bench for Premiere Pro 2.0.1 Adobe After Effects 26.0 — Puget Bench for After Effects 1.1.0 DaVinci Resolve 20.3 — Puget Bench for DaVinci Resolve 2.0.0 Blender 5.0.0 Unreal Engine 5.7 Unigine Superposition 1.0 MLPerf Client v1.0 Autodesk Revit 25.3 — RFO Benchmark 3.4 Autodesk Inventor 29.0 — InvMark 2025.0.15 SOLIDWORKS 2024 5.0— SPECapc for SOLIDWORKS2024.1.13
As is typical with our GPU reviews, we used an AMD Ryzen™ 9 9950X3D and ASUS ProArt X670E-Creator-based test bed. We have found that, in most workflows we test with, the 9950X3D offers the best all-around performance, and so should minimize potential CPU-side bottlenecks. We used the latest available GPU drivers for this testing, and Windows settings like VBS were kept enabled. We tested using a standard set of professional productivity benchmarks for this review: most of the Puget Bench suite, some offline and real-time renderers like Unreal Engine, Blender, and Unigine, an AI GPU benchmark in MLPerf, and most of our standard Engineering test suite.
Lightroom Classic
!Image 3: Bar chart of Overall score in Puget Bench for Lightroom Classic
!Image 4: Bar chart of AI score in Puget Bench for Lightroom Classic
!Image 5: Bar chart of Export score in Puget Bench for Lightroom Classic
!Image 6: Bar chart of Overall score in Puget Bench for Lightroom Classic
!Image 7: Bar chart of AI score in Puget Bench for Lightroom Classic
!Image 8: Bar chart of Export score in Puget Bench for Lightroom Classic
##### System Image
×
!Image 9: Bar chart of Overall score in Puget Bench for Lightroom Classic
!Image 10: Bar chart of AI score in Puget Bench for Lightroom Classic
!Image 11: Bar chart of Export score in Puget Bench for Lightroom Classic
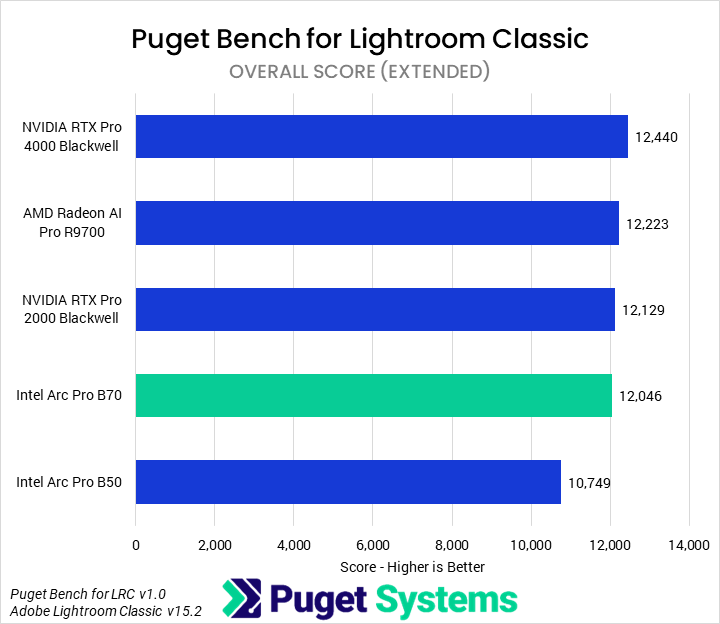
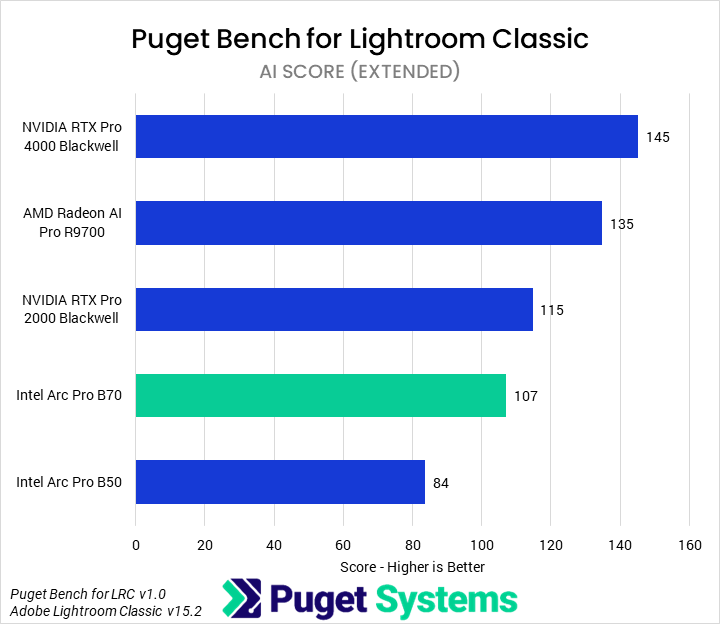
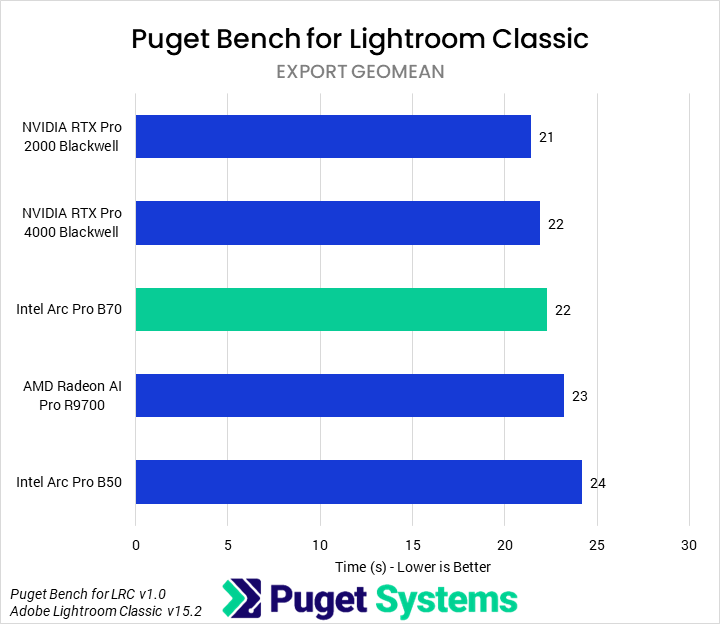
The first benchmark we tested with was Lightroom Classic. Overall (Chart #1), we found that the B70 showed 12% uplifts over the B50, though it still ended up slower than any of the other GPUs by a small margin (3% or less). Most of Lightroom is not GPU-accelerated, however, so we didn’t expect to see a huge impact from the GPU on overall performance. AI effects (Chart #2) _are_ often GPU-accelerated, though, so we saw more differentiation there. The B70 maintained its spot second from the bottom, though in those tests it was 27% faster than the B50. The 2000 Blackwell was 7% faster than it, while the R9700 was 26%. We also examined Export times (Chart #3) as those tend to be partially GPU-accelerated. While there was some impact on performance, and the B70 outperformed the R9700, the differences were, overall, small enough not to make a huge impact.
While we wouldn’t recommend a B70 for Lightroom Classic — a 2000 Blackwell is probably the best of those tested, unless using a large amount of AI effects — we wouldn’t normally recommend a professional-class GPU for Lightroom Classic at all.
Premiere
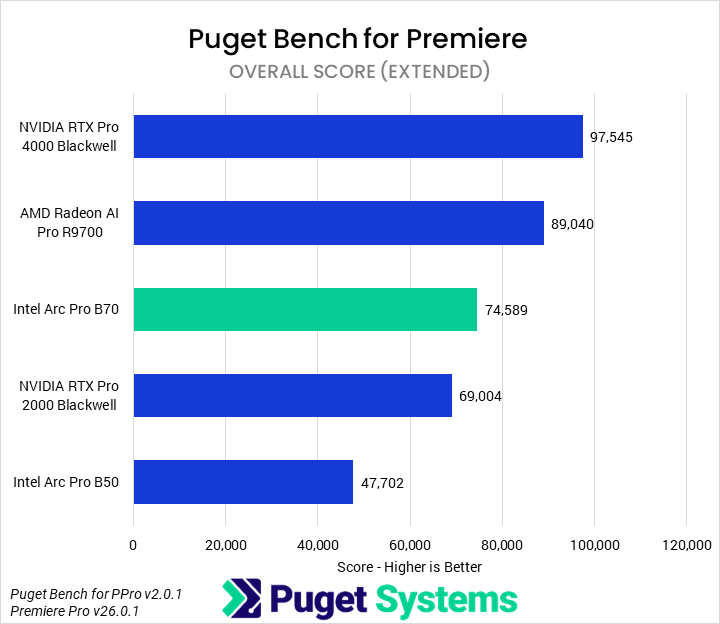
!Image 12: Bar chart of Overall score in Puget Bench for Premiere
!Image 13: Bar chart of LongGOP score in Puget Bench for Premiere
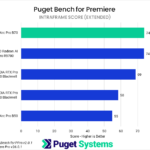
!Image 14: Bar chart of Intraframe score in Puget Bench for Premiere
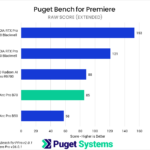
!Image 15: Bar chart of RAW score in Puget Bench for Premiere
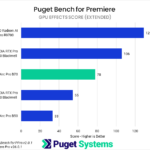
!Image 16: Bar chart of GPU Effects score in Puget Bench for Premiere
!Image 17: Bar chart of Overall score in Puget Bench for Premiere
!Image 18: Bar chart of LongGOP score in Puget Bench for Premiere
!Image 19: Bar chart of Intraframe score in Puget Bench for Premiere
!Image 20: Bar chart of RAW score in Puget Bench for Premiere
!Image 21: Bar chart of GPU Effects score in Puget Bench for Premiere
##### System Image
×
!Image 22: Bar chart of Overall score in Puget Bench for Premiere
!Image 23: Bar chart of LongGOP score in Puget Bench for Premiere
!Image 24: Bar chart of Intraframe score in Puget Bench for Premiere
!Image 25: Bar chart of RAW score in Puget Bench for Premiere
!Image 26: Bar chart of GPU Effects score in Puget Bench for Premiere
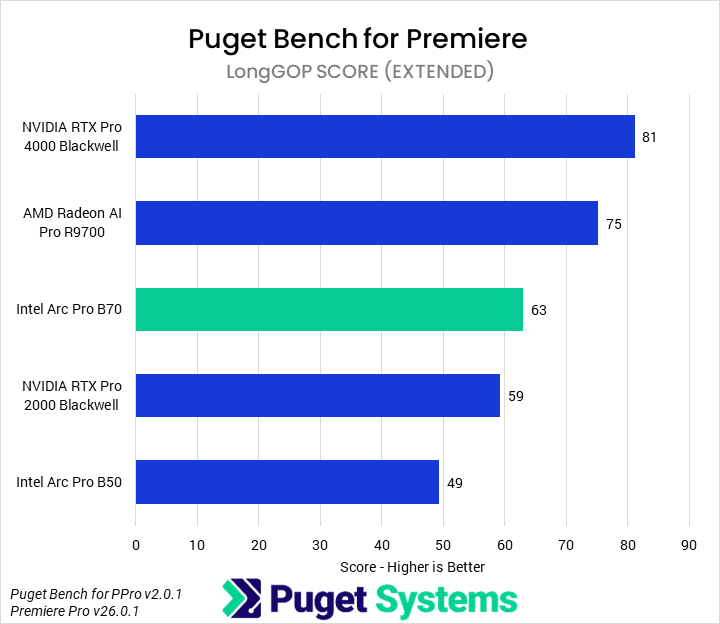
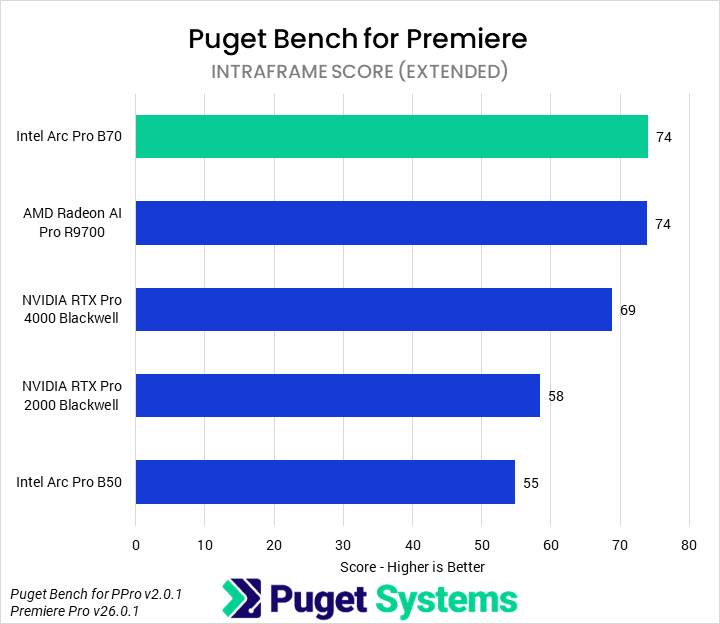
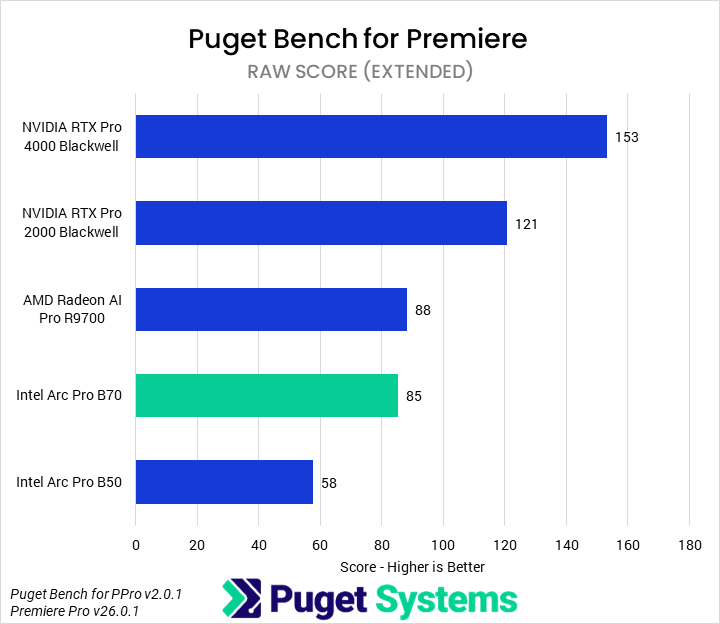
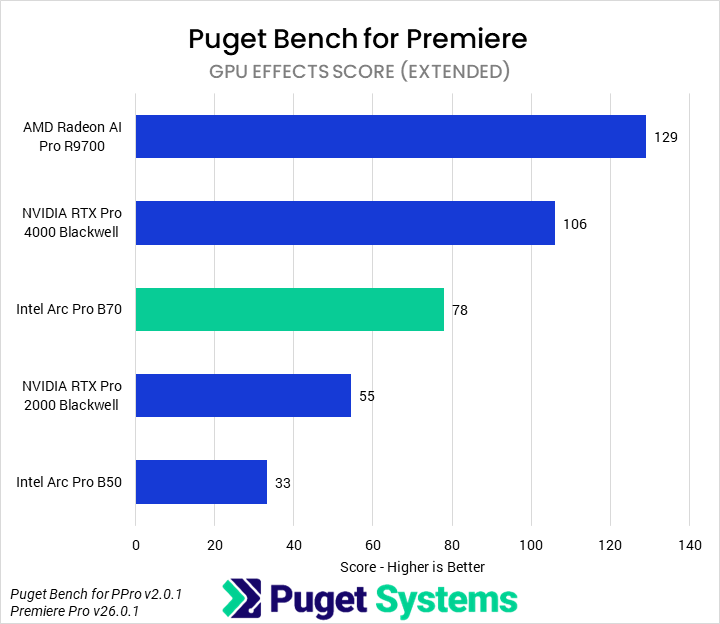
The next benchmark we tested with was Puget Bench for Premiere. Professional GPUs, while offering advantages in some workflows, typically offer less value for most media and entertainment applications than consumer cards do. Starting with the Overall score (Chart #1), we found that the B70 was 56% faster than the B50 and 8% faster than the 2000 Blackwell. In turn, it was 16% slower than the R9700 and 24% slower than the 4000 Blackwell. Although it had nominally superior media engines for accelerating most LongGOP work, the overall LongGOP score (Chart #2) was dragged down by subpar performance (compared to the R9700 and 4000 Blackwell) in the “real world” tests, placing it solidly in the middle of the pack. The B70 struggled in the RAW media tests (Chart #4), matching only the R9700 but falling well behind NVIDIA’s cards. In GPU Effects (Chart #5), the B70 was similarly middle of the pack, showing more than twice the performance of the B50 but trailing behind the 4000 Blackwell and R9700. Overall, the B70 offers a fine value relative to other professional GPUs for Premiere, but not anything outstanding.
After Effects
!Image 27: Bar chart of Overall score in Puget Bench for After Effects
!Image 28: Bar chart of 2D score in Puget Bench for After Effects
!Image 29: Bar chart of 3D score in Puget Bench for After Effects
!Image 30: Bar chart of Tracking score in Puget Bench for After Effects
!Image 31: Bar chart of Overall score in Puget Bench for After Effects
!Image 32: Bar chart of 2D score in Puget Bench for After Effects
!Image 33: Bar chart of 3D score in Puget Bench for After Effects
!Image 34: Bar chart of Tracking score in Puget Bench for After Effects
##### System Image
×
!Image 35: Bar chart of Overall score in Puget Bench for After Effects
!Image 36: Bar chart of 2D score in Puget Bench for After Effects
!Image 37: Bar chart of 3D score in Puget Bench for After Effects
!Image 38: Bar chart of Tracking score in Puget Bench for After Effects
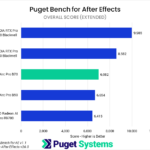
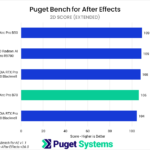
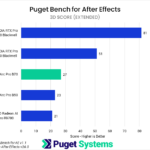
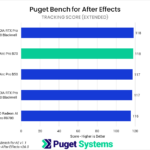
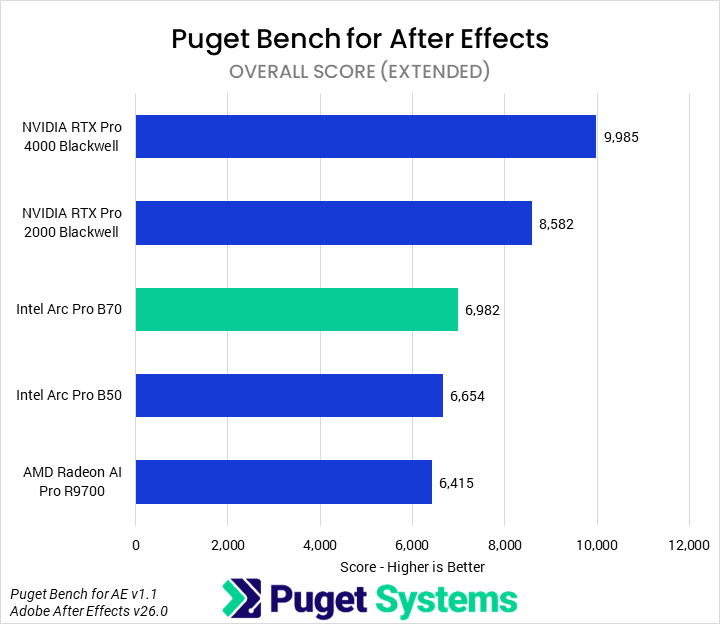
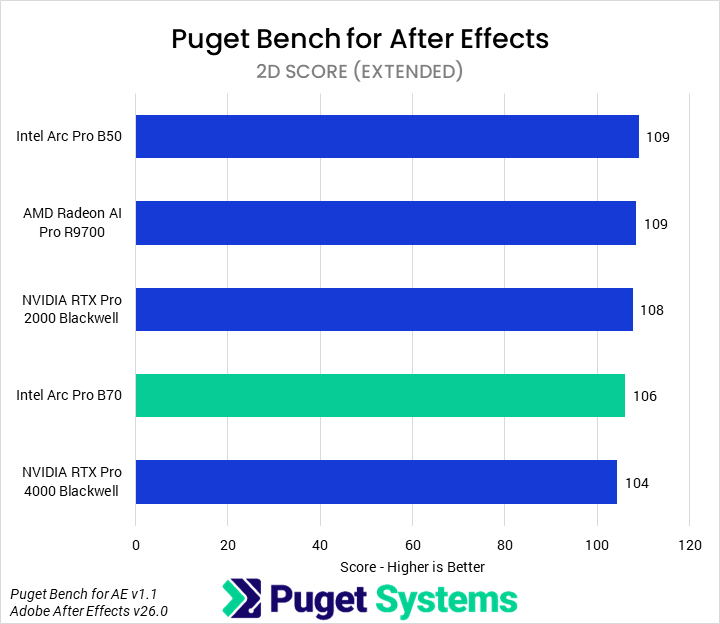
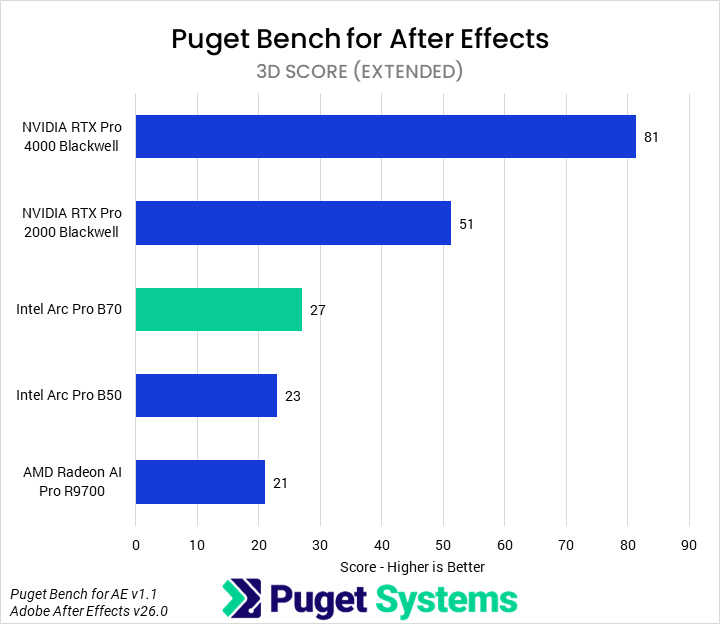
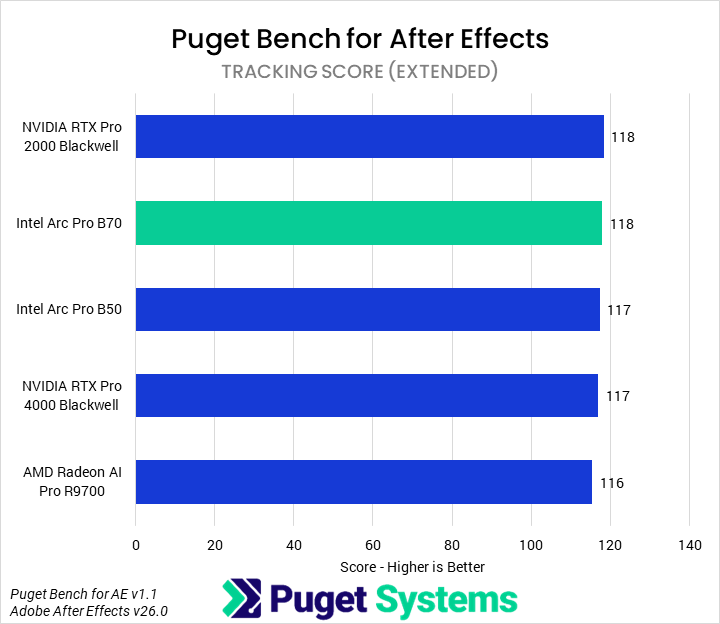
In Adobe After Effects, only one area is properly GPU-accelerated: 3D. Other workflows are almost wholly CPU-based, and so do not scale with GPU. Due to this, we will only examine the 3D score (Chart #3). Our testing found that 3D workflows in After Effects are still highly optimized for NVIDIA GPUs: the B70, though 17% faster than the B50 and 29% faster than the R9700, was 47% slower than the 2000 Blackwell and offered one-third the performance of the 4000 Blackwell. We would recommend end users stick to consumer NVIDIA GPUs for After Effects.
DaVinci Resolve
!Image 39: Bar chart of Overall score in Puget Bench for DaVinci Resolve
!Image 40: Bar chart of LongGOP score in Puget Bench for DaVinci Resolve
!Image 41: Bar chart of Intraframe score in Puget Bench for DaVinci Resolve
!Image 42: Bar chart of RAW score in Puget Bench for DaVinci Resolve
!Image 43: Bar chart of GPU Effects score in Puget Bench for DaVinci Resolve
!Image 44: Bar chart of AI score in Puget Bench for DaVinci Resolve
!Image 45: Bar chart of Fusion score in Puget Bench for DaVinci Resolve
!Image 46: Bar chart of Overall score in Puget Bench for DaVinci Resolve
!Image 47: Bar chart of LongGOP score in Puget Bench for DaVinci Resolve
!Image 48: Bar chart of Intraframe score in Puget Bench for DaVinci Resolve
!Image 49: Bar chart of RAW score in Puget Bench for DaVinci Resolve
!Image 50: Bar chart of GPU Effects score in Puget Bench for DaVinci Resolve
!Image 51: Bar chart of AI score in Puget Bench for DaVinci Resolve
!Image 52: Bar chart of Fusion score in Puget Bench for DaVinci Resolve
##### System Image
×
!Image 53: Bar chart of Overall score in Puget Bench for DaVinci Resolve
!Image 54: Bar chart of LongGOP score in Puget Bench for DaVinci Resolve
!Image 55: Bar chart of Intraframe score in Puget Bench for DaVinci Resolve
!Image 56: Bar chart of RAW score in Puget Bench for DaVinci Resolve
!Image 57: Bar chart of GPU Effects score in Puget Bench for DaVinci Resolve
!Image 58: Bar chart of AI score in Puget Bench for DaVinci Resolve
!Image 59: Bar chart of Fusion score in Puget Bench for DaVinci Resolve
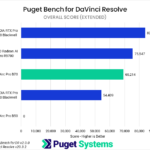
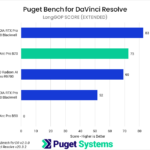
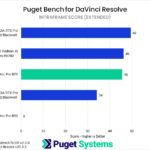
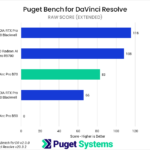
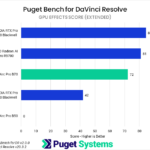
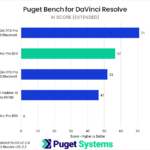
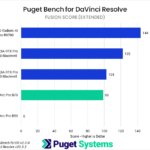
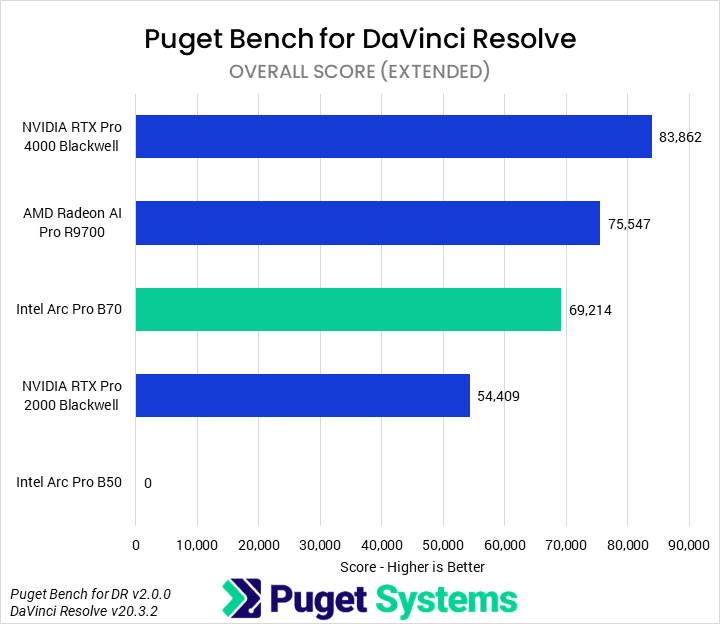
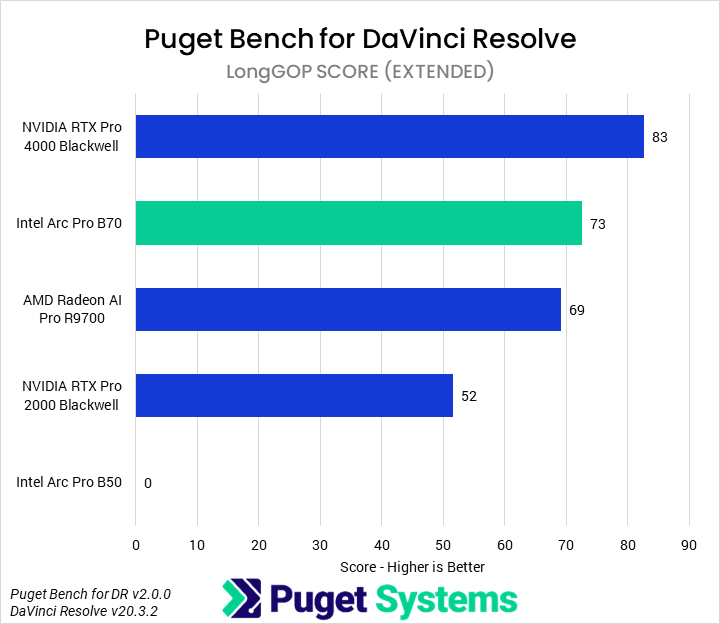
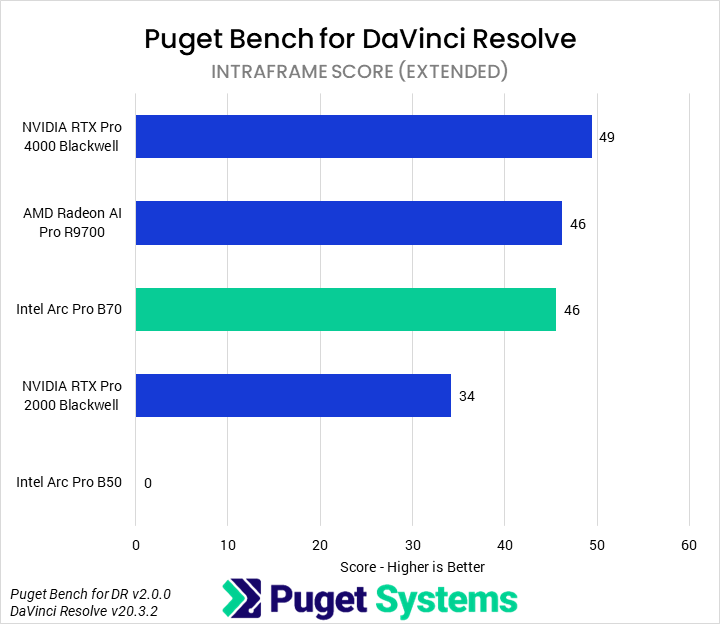
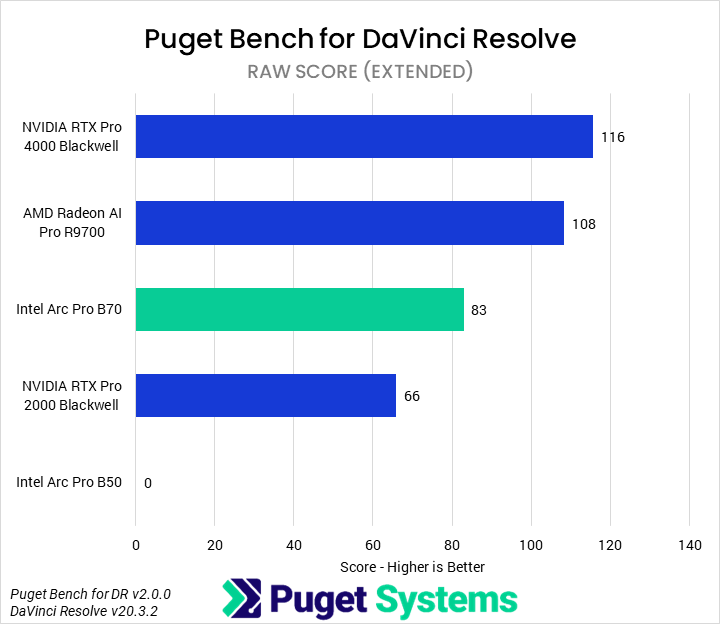
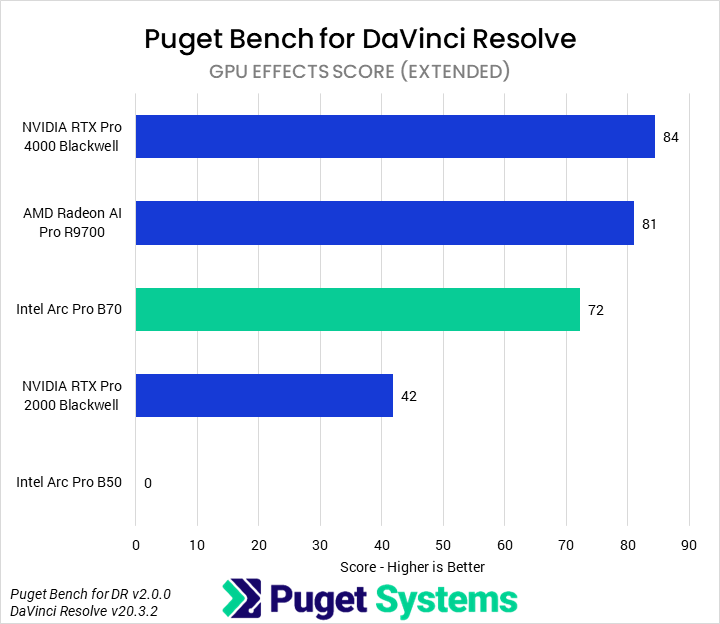
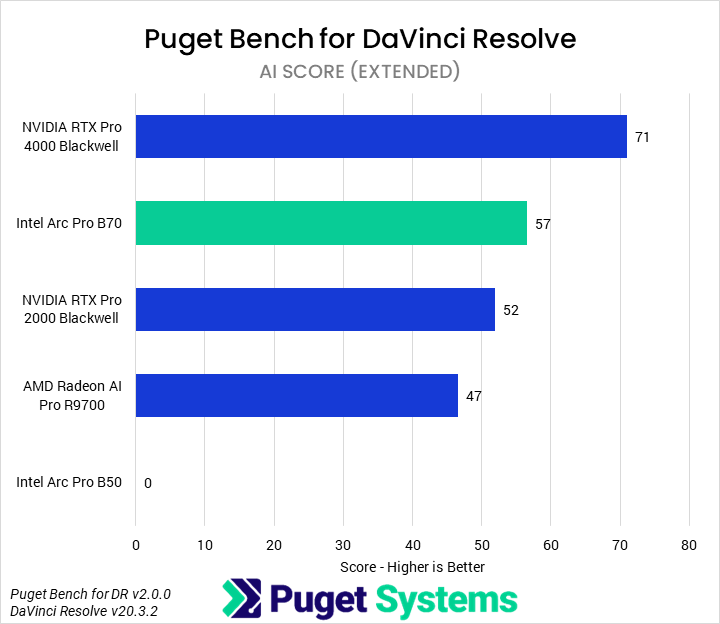
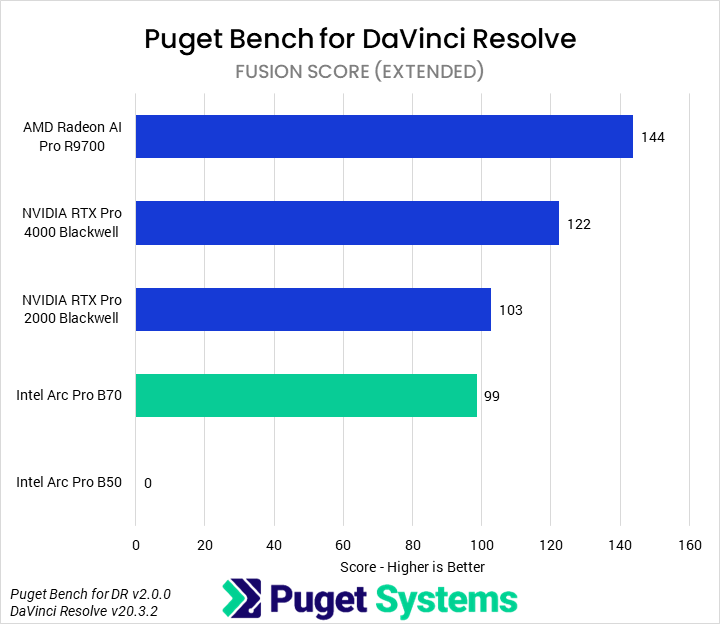
We won’t be diving into all the details of every subtest for DaVinci Resolve, either. Our comparison also omits the B50, as we experienced an ongoing issue where it repeatedly failed to successfully complete an extended run of our DaVinci Resolve benchmark. Overall (Chart #1), the B70 performed acceptably, with a 27% performance advantage over the 2000 Blackwell but 8% slower than the R9700 and 17% slower than the 4000 Blackwell. This positions it as a solid performer at its price point, but not the best. Although always slower than the 4000 Blackwell, the B70 performed well in the LongGOP and AI tests (Charts #2 and #6), outperforming the R9700 by 5-10%. However, it struggled somewhat in the RAW and GPU Effects tests (Charts #4 and #5), performing up to 24% slower than the R9700. It also performed fairly poorly in the Fusion tests (Chart #7), scoring even lower than the 2000 Blackwell.
Blender
!Image 60: Bar chart of GPU score in Blender benchmark
##### Image
×
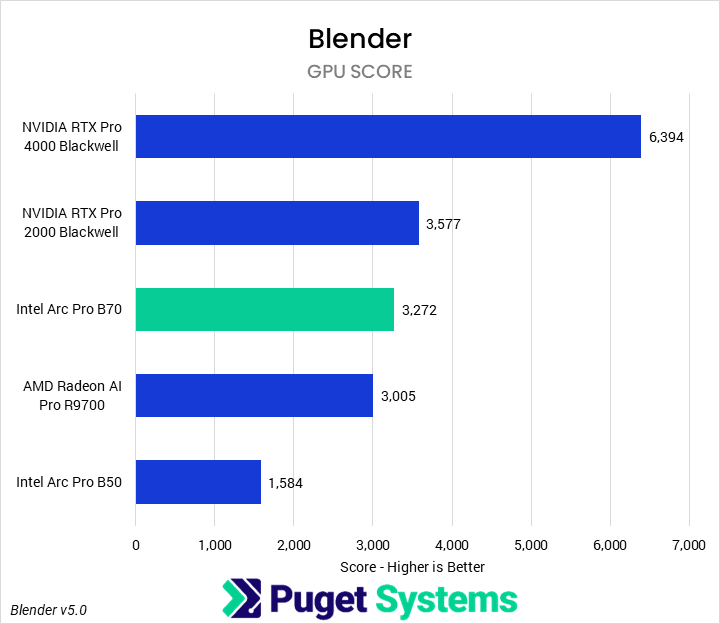
Over the last year or two, Intel has worked to deliver serious optimizations for and compatibility with Blender GPU rendering on its Arc GPUs. Although NVIDIA has long held an advantage in the application, our last time looking at Intel’s cards indicated ongoing improvements. This round of testing is no different. We found that the Arc Pro B70 provided more than twice the performance of the B50, also beating the R9700 by 9%. This still made it slower than the 2000 Blackwell by 8%, but for complex VRAM-heavy scenes on a budget, it offers an acceptable value. We hope that, in the future, there will be real options other than NVIDIA for GPU-based rendering, as it is an area where competition is nearly non-existent.
Unreal Engine
!Image 62: Bar chart of overall fps geomean in Unigine Superposition
!Image 63: Bar chart of 1080P fps geomean in Unigine Superposition
!Image 64: Bar chart of 4K fps geomean in Unigine Superposition
!Image 65: Bar chart of rasterized fps geomean in Unigine Superposition
!Image 66: Bar chart of raytraced fps geomean in Unigine Superposition
!Image 67: Bar chart of overall fps geomean in Unigine Superposition
!Image 68: Bar chart of 1080P fps geomean in Unigine Superposition
!Image 69: Bar chart of 4K fps geomean in Unigine Superposition
!Image 70: Bar chart of rasterized fps geomean in Unigine Superposition
!Image 71: Bar chart of raytraced fps geomean in Unigine Superposition
##### System Image
×
!Image 72: Bar chart of overall fps geomean in Unigine Superposition
!Image 73: Bar chart of 1080P fps geomean in Unigine Superposition
!Image 74: Bar chart of 4K fps geomean in Unigine Superposition
!Image 75: Bar chart of rasterized fps geomean in Unigine Superposition
!Image 76: Bar chart of raytraced fps geomean in Unigine Superposition
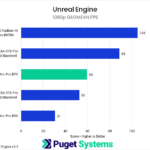
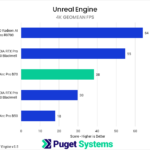
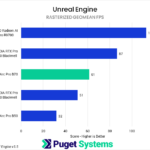
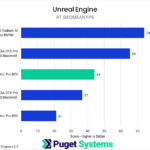
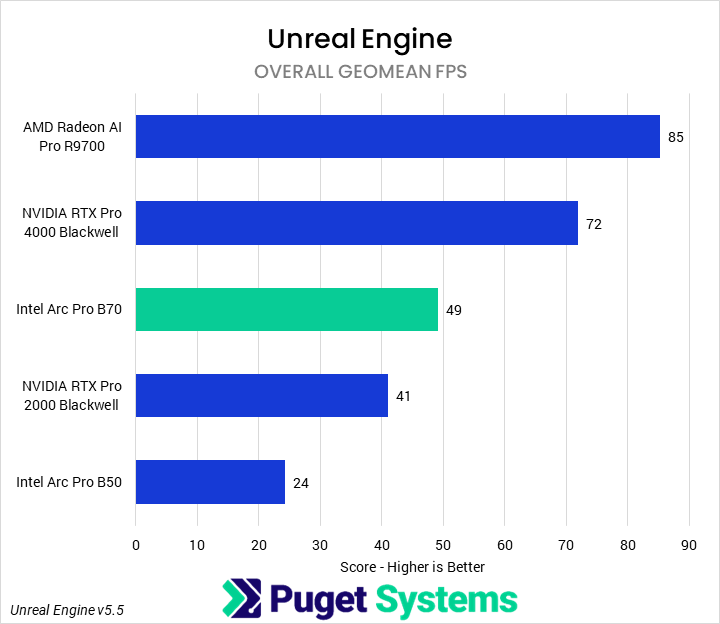
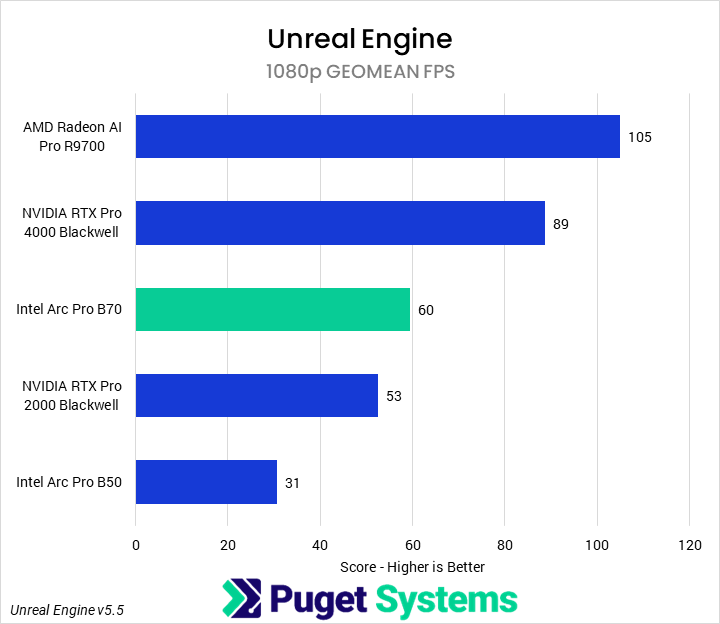
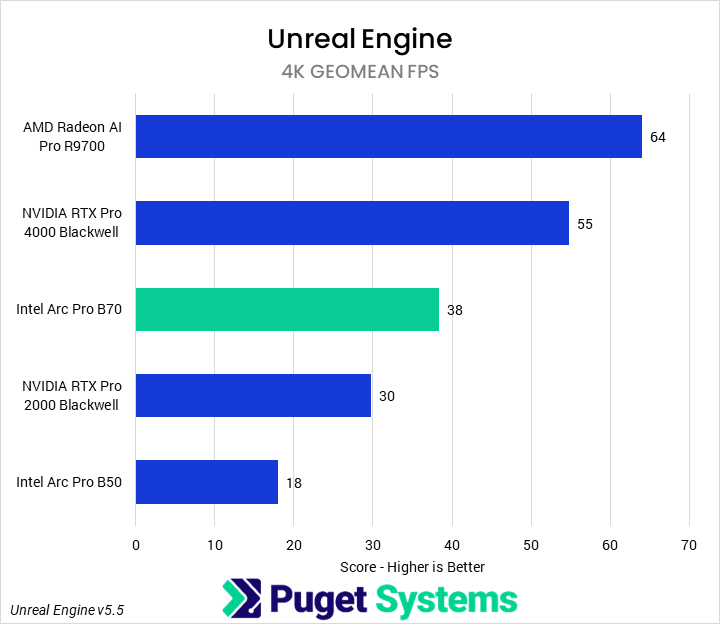
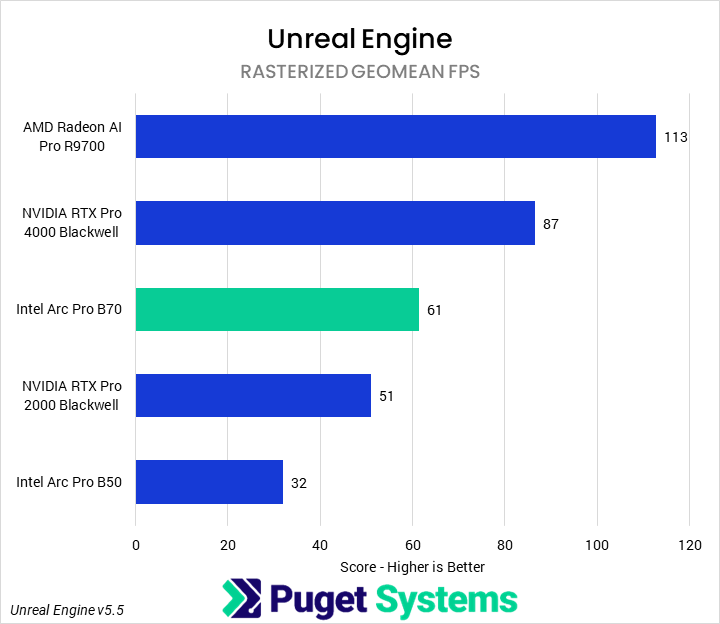
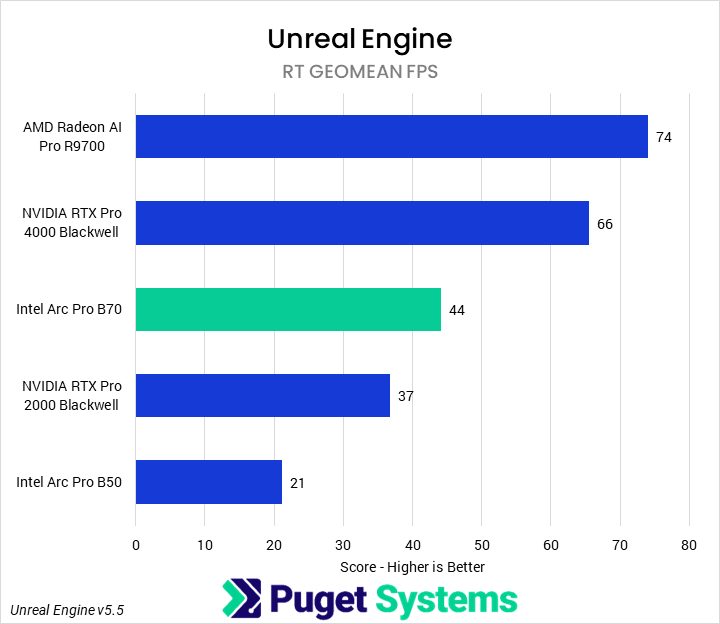
For our in-engine Unreal Engine benchmark, we run three different scenes each at three different resolutions; they represent some possible different workflows within Unreal Engine, from game development to architecture visualization, and each uses different features such as hardware RT or Nanite. This allows us to combine the individual scene results into feature-specific scores; here, we have created an overall score, as well as combined 1080p and 4K scores, as well as rasterized and RT scores. Sometimes this can show interesting differences in prioritization or scaling across hardware.
In this case, we didn’t see too much variation across the combination scores, showing that, at this tier of hardware, all of the architectures are fairly similarly balanced — though we did still see AMD perform relatively less well at RT than Intel or NVIDIA. The B70 performed solidly, middle of the pack here (in line with its price), though its overall price-to-performance ratio leaves something to be desired compared to nearly every other GPU. Overall (Chart #1), it was 90% faster than the B50 and 20% faster than the 2000 Blackwell. However, it was also 30% slower than a 4000 Blackwell and, more importantly, 47% slower than the R9700.
Unigine
!Image 77: Bar chart of score geomean in Unigine Superposition
##### Image
×
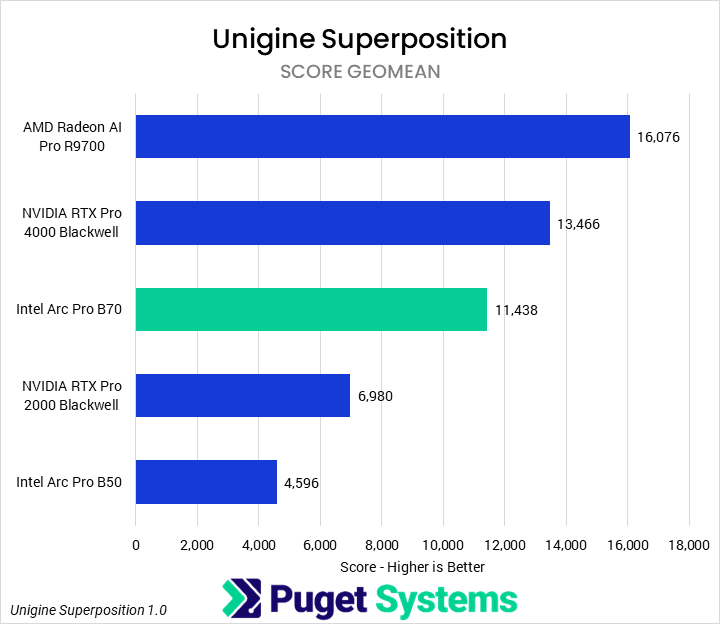
Unigine Superposition is an industry-standard in-engine rendering benchmark. For this score, we computed a geomean of the score from runs at 1080p extreme, 1080p high, 4K optimized, and 8K optimized (we didn’t observe too much CPU bottlenecking at any of these settings). Our testing showed that the B70 was 1.5 times faster than the B50, and 64% faster than the 2000 Blackwell. Although it could not match the more expensive GPUs, it came somewhat close, falling 17% behind the 4000 Blackwell. However, the R9700 was the clear leader, a full 40% faster than the B70. This does make us wonder how a consumer-oriented GPU with the B70’s die would stack up in games, though.
MLPerf
!Image 79: Bar chart of time to first token in MLPerf
!Image 80: Bar chart of token generation rate in MLPerf
!Image 81: Bar chart of time to first token in MLPerf
!Image 82: Bar chart of token generation rate in MLPerf
##### System Image
×
!Image 83: Bar chart of time to first token in MLPerf
!Image 84: Bar chart of token generation rate in MLPerf
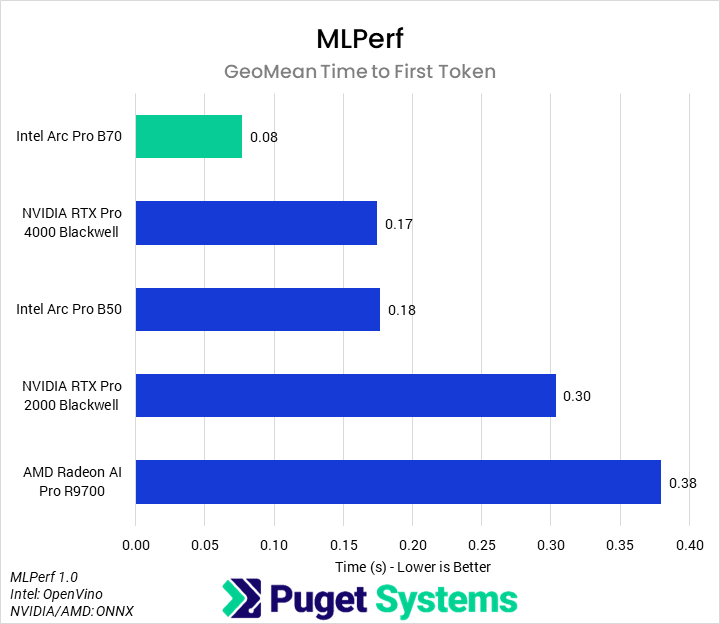
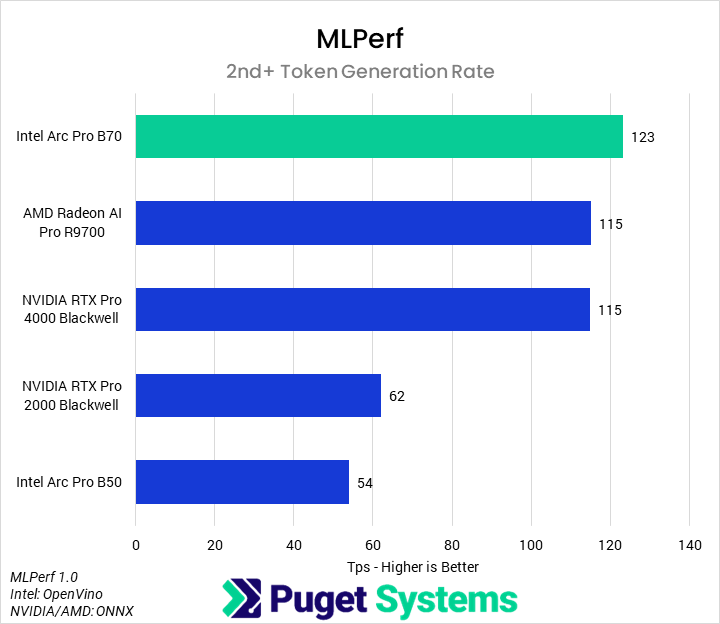
MLPerf Client is probably the most relevant benchmark we tested with for this review; with 32 GB of VRAM at $950, the B70 is really positioned as an AI-inference card rather than a general professional workstation card. Although AI inference performance can depend heavily on the specific optimizations and model used, MLPerf is a standardized benchmark that we think gives a good indication of potential. And with it, we found that the B70 performs incredibly well. In the time to first token measurements (Chart #1), the B70 was incredibly fast, returning the first token, on average, in half the time as the 4000 Blackwell and the B50, and in less than one-third the time of the 2000 Blackwell or R9700. More importantly, in the overall token generation rate (Chart #2), we found that the B70 was the most performant tested GPU. It beat the R9700 and 4000 Blackwell by 7%, the 2000 Blackwell by 98%, and the B50 by 128%.
Revit
!Image 85: Bar chart of Model Creation time in RFO Benchmark for Autodesk Revit
!Image 86: Bar chart of Export time in RFO Benchmark for Autodesk Revit
!Image 87: Bar chart of Graphics time in RFO Benchmark for Autodesk Revit
!Image 88: Bar chart of Model Creation time in RFO Benchmark for Autodesk Revit
!Image 89: Bar chart of Export time in RFO Benchmark for Autodesk Revit
!Image 90: Bar chart of Graphics time in RFO Benchmark for Autodesk Revit
##### System Image
×
!Image 91: Bar chart of Model Creation time in RFO Benchmark for Autodesk Revit
!Image 92: Bar chart of Export time in RFO Benchmark for Autodesk Revit
!Image 93: Bar chart of Graphics time in RFO Benchmark for Autodesk Revit
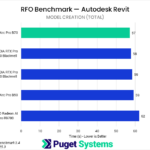
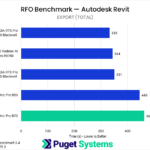
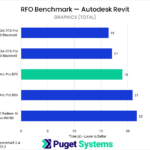
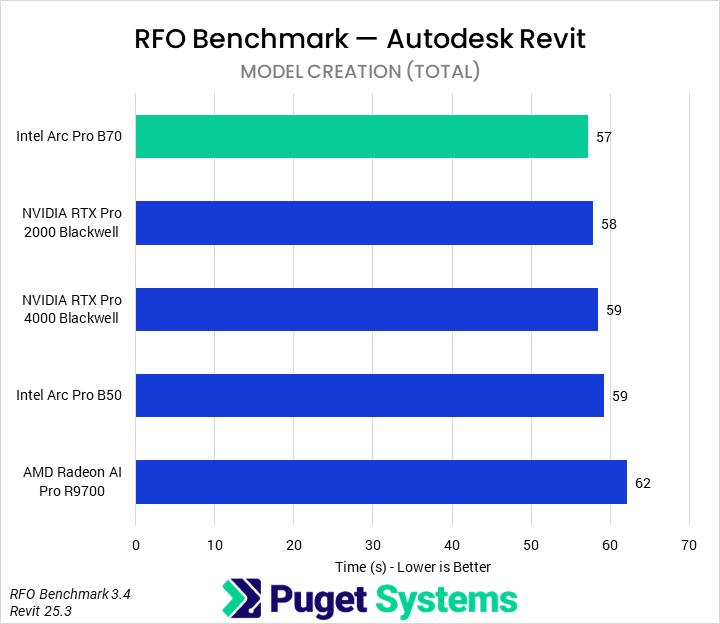
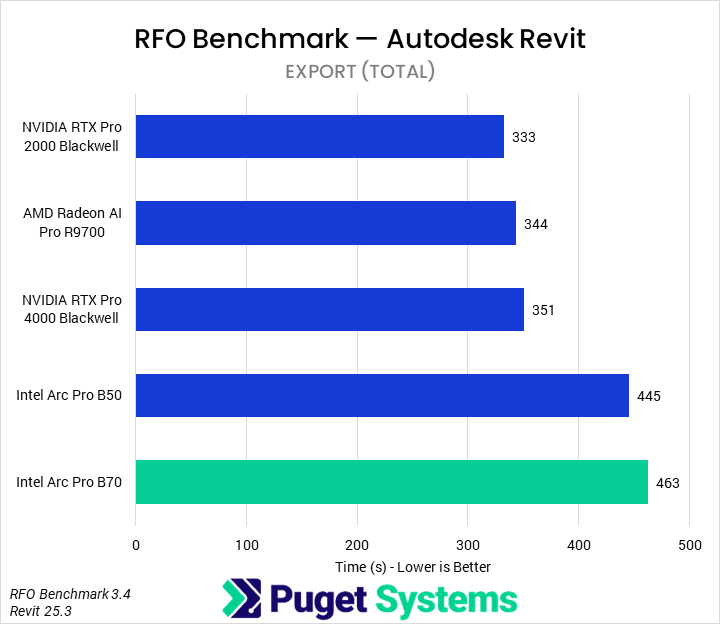
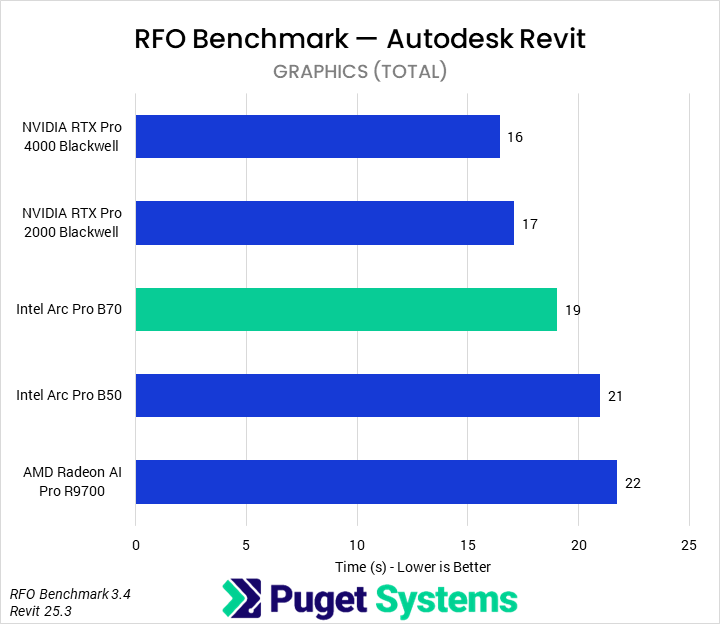
For our Revit testing, we benchmarked each GPU using the Full_Standard preset. In terms of model creation time (Chart #1), we saw a small impact from the GPU. There may be some differences based on manufacturer, but most of the results are within the margin of error. Interestingly, we saw a larger difference in export time (Chart #2), where the Intel GPUs underperformed relative to AMD or NVIDIA. We’re not sure if this is caused by an architectural difference, pipeline difference, or bug in either the driver or software, but it appears that exports are noticeably slower when an Intel GPU is installed. Finally, in graphics time (Chart #3), the B70 was exactly in the middle of the pack, 14% and 10% faster than the R9700 and B50, respectively. However, given that it was slower than the 2000 Blackwell, we would recommend users stick to NVIDIA professional GPUs for Revit.
Inventor
!Image 94: Bar chart of graphics score in InvMark for Autodesk Inventor
##### Image
×
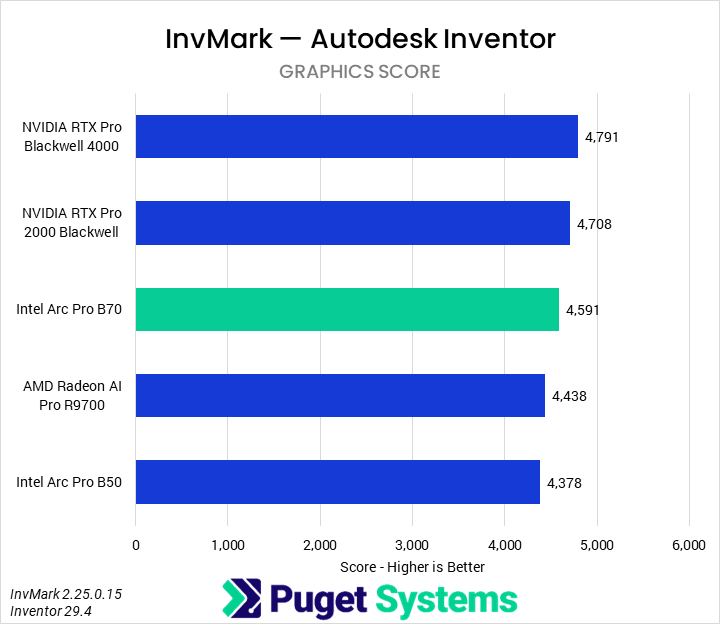
As most of Inventor is not substantially GPU accelerated, we only pulled out the graphics score; this is about the only subscore that scales with GPUs anyway. We found that the Intel Arc Pro B70 was 5% faster than the B50 and R9700, and about 5% slower than the 2000 Blackwell and 4000 Blackwell. Given these small performance deltas, we would recommend the 2000 Blackwell or, on a budget, the B50.
SOLIDWORKS
!Image 96: Bar chart of GPU Composite score in SPECapc for SOLIDWORKS
!Image 97: Bar chart of GPU Shaded score in SPECapc for SOLIDWORKS
!Image 98: Bar chart of GPU Shaded with Edges score in SPECapc for SOLIDWORKS
!Image 99: Bar chart of GPU Shaded Realview score in SPECapc for SOLIDWORKS
!Image 100: Bar chart of GPU Shaded with Edges Realview score in SPECapc for SOLIDWORKS
!Image 101: Bar chart of GPU Hidden Lines Removed score in SPECapc for SOLIDWORKS
!Image 102: Bar chart of GPU Drawing score in SPECapc for SOLIDWORKS
!Image 103: Bar chart of GPU Composite score in SPECapc for SOLIDWORKS
!Image 104: Bar chart of GPU Shaded score in SPECapc for SOLIDWORKS
!Image 105: Bar chart of GPU Shaded with Edges score in SPECapc for SOLIDWORKS
!Image 106: Bar chart of GPU Shaded Realview score in SPECapc for SOLIDWORKS
!Image 107: Bar chart of GPU Shaded with Edges Realview score in SPECapc for SOLIDWORKS
!Image 108: Bar chart of GPU Hidden Lines Removed score in SPECapc for SOLIDWORKS
!Image 109: Bar chart of GPU Drawing score in SPECapc for SOLIDWORKS
##### System Image
×
!Image 110: Bar chart of GPU Composite score in SPECapc for SOLIDWORKS
!Image 111: Bar chart of GPU Shaded score in SPECapc for SOLIDWORKS
!Image 112: Bar chart of GPU Shaded with Edges score in SPECapc for SOLIDWORKS
!Image 113: Bar chart of GPU Shaded Realview score in SPECapc for SOLIDWORKS
!Image 114: Bar chart of GPU Shaded with Edges Realview score in SPECapc for SOLIDWORKS
!Image 115: Bar chart of GPU Hidden Lines Removed score in SPECapc for SOLIDWORKS
!Image 116: Bar chart of GPU Drawing score in SPECapc for SOLIDWORKS
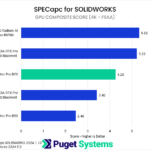
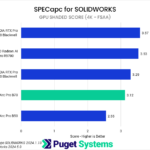
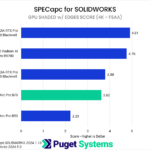
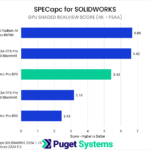
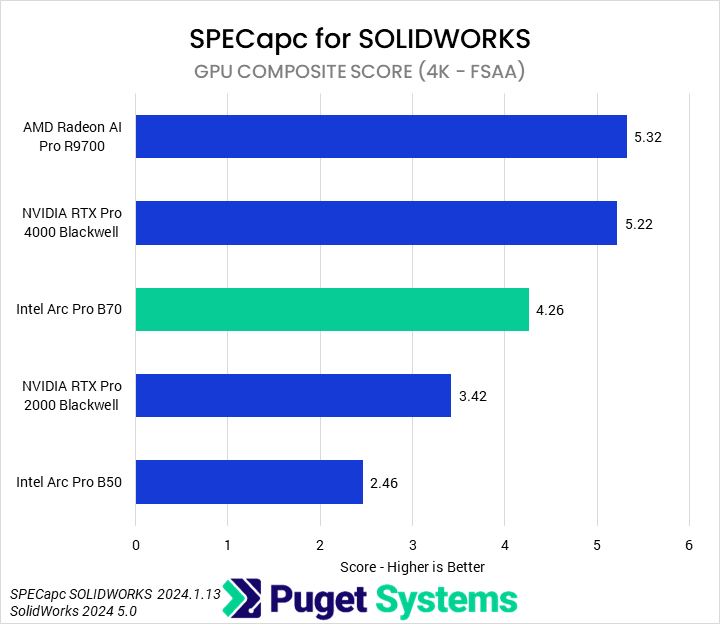
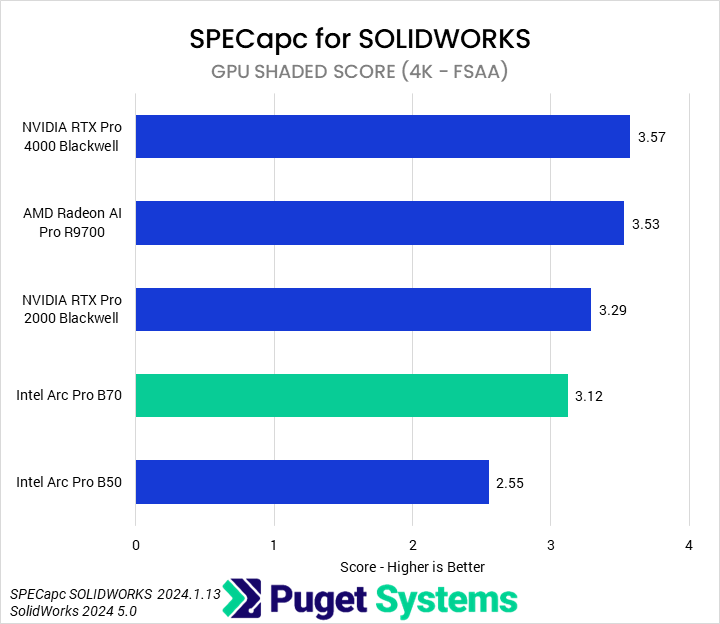
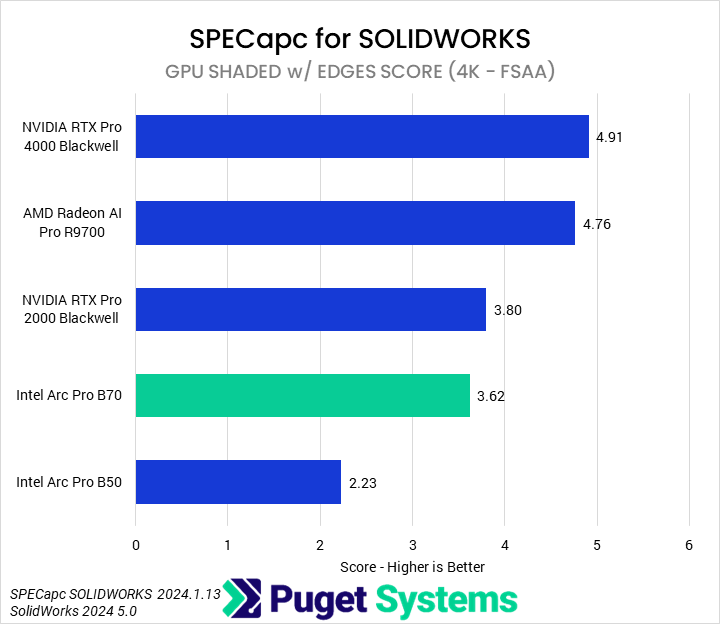
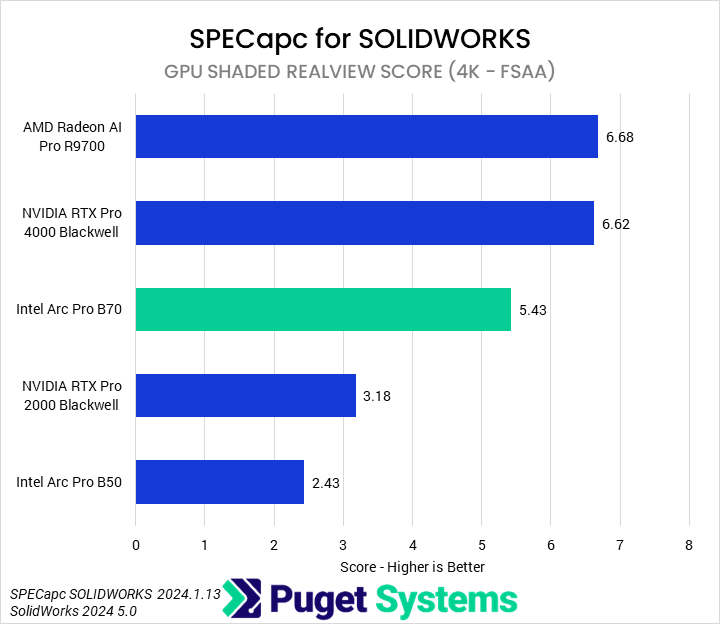
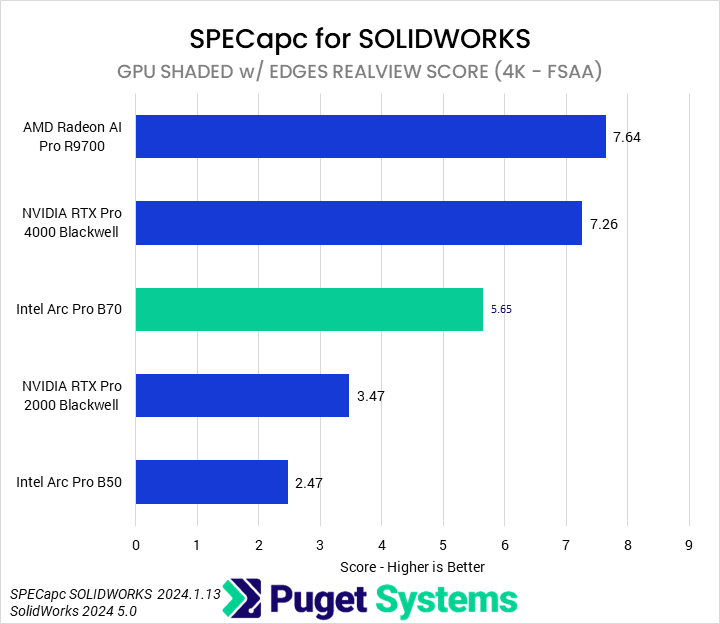
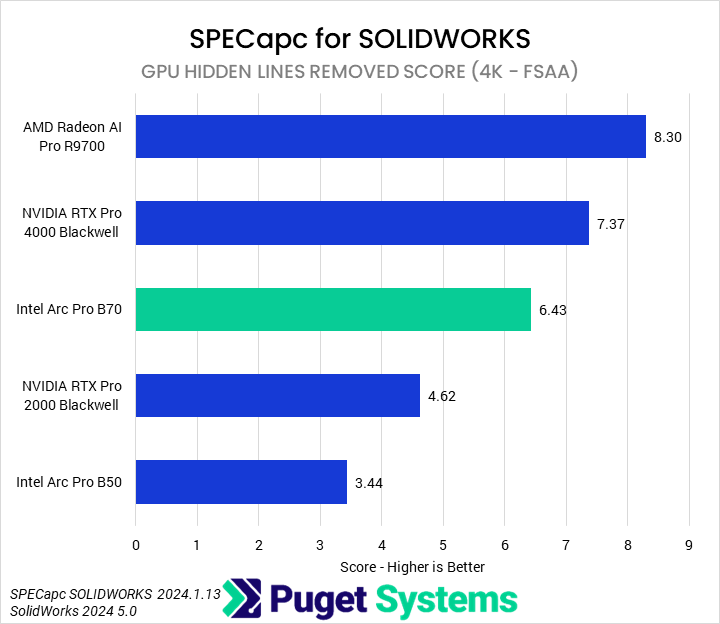
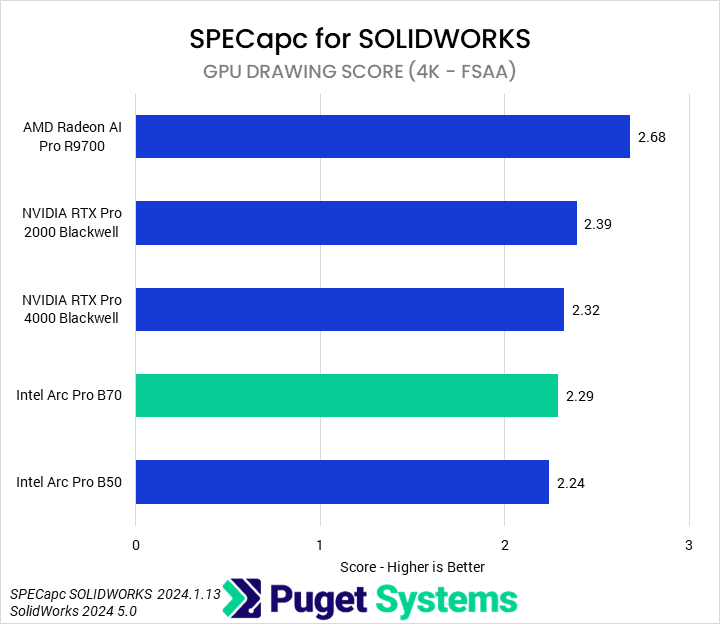
The final benchmark we tested with was SPECapc for SOLIDWORKS 2024. As is typical in these reviews, we will only be focusi